15 HR Metrics for People Analytics in India 2025
Boost workplace culture with 15 HR metrics for Indian startups in 2025. Master people analytics in India to drive engagement and ROI.

Introduction: Why Metrics Are HR’s Secret Weapon
Did you know 73% of Indian HR leaders say proving ROI is their top challenge (LinkedIn India, 2024)?
I felt that pressure early in my 20-year HR career, dodging tough questions about “team morale” in a Mumbai boardroom. Then, at a Bengaluru startup, I slashed turnover from 27% to 9% in 15 months using data. That’s when I realized HR metrics for Indian startups are more than numbers—they’re the key to proving HR’s strategic value. In this post, I’ll share 15 talent management KPIs, tailored for India’s vibrant workplaces, with examples to strengthen your workplace culture. Ready to transform your HR strategy with people analytics in India 2025? Let’s get started.
Key Takeaways
HR metrics link people to business success.
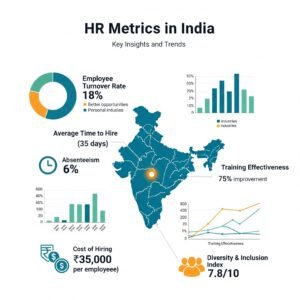
India’s IT turnover averages 18%—know your numbers (NASSCOM).
Data-driven HR boosts decisions 3x (SHRM).
Why Metrics Matter for Indian Companies
What if you could spot a talent crisis before it stalls your growth? I watched a Hyderabad startup lose 32% of its developers by ignoring “time-to-hire” metrics. Their competitor, using people analytics, cut hiring time by 25% and won the talent race. Metrics let you:
Catch risks early.
Show financial impact.
Plan for India’s 2025 market.
How can employee engagement metrics for Indian companies align with your goals? Let’s dive into 15 key metrics.
Top 15 HR Metrics in India for 2025
Recruitment Metrics
1. Turnover Rate (Voluntary & Involuntary) 💼
Formula: (Departures ÷ Average headcount) × 100
Example: A Pune startup with 200 employees had 40 exits (20% rate). Exit data showed poor flexibility. New schedules cut turnover to 7%, saving ₹48 lakh. India’s IT average is 18% (NASSCOM).
What’s behind your turnover rates?
2. Cost Per Hire 💰
Formula: (Internal + External Recruiting Costs) ÷ Total Hires
Example: A Chennai firm spent ₹10 lakh on ads and ₹4 lakh on recruiters for 70 hires (₹20,000/hire). Using Keka for referrals dropped it to ₹12,000, saving ₹5.6 lakh.
What costs might your hiring process hide?
3. Time to Fill ⏳
Formula: Total days open ÷ Roles filled
Example: A Delhi IT company took 70 days to fill 10 roles, delaying projects. An internal pool via ZingHR cut it to 38 days (benchmark: 42 days).
How does your time-to-fill affect operations?
4. Offer Acceptance Rate 🤝
Formula: (Accepted offers ÷ Extended offers) × 100
Example: A Mumbai startup’s 60% rate rose to 90% with flexible benefits, saving ₹8 lakh in searches.
What stops candidates from saying yes?
Engagement Metrics
5. Employee Engagement Score 😊
Example: A Kolkata firm scored 3.5/5 on Gallup’s Q12. Monthly pulses via CultureMonkey raised it to 4.5, cutting delays by 10%.
How often do you measure engagement?
6. Employee Net Promoter Score (eNPS) 🌟
Formula: % Promoters (9-10) – % Detractors (0-6)
Example: An Ahmedabad NGO’s eNPS of +15 hit +40 after culture fixes, boosting funding by ₹2 crore.
What does your eNPS say about your culture?
7. Absenteeism Rate 😴
Formula: (Absent days ÷ Total workdays) × 100
Example: A Bengaluru call center’s 6% rate (600 absent days/10,000 workdays) fell to 2% with task rotation, saving ₹7 lakh.
What might absenteeism reveal?
8. Diversity Ratio 🌍
Example: A Hyderabad startup raised women in leadership from 14% to 31% with diversity bonuses, attracting ₹4.5 crore in investments.
How does diversity shape your workplace?
Productivity Metrics
9. Time to Productivity 🚀
Formula: Days until performance standards met
Example: A Chennai plant’s hires took 90 days to pass quality checks. Darwinbox analytics cut this to 60 days, saving ₹13 lakh (onboarding guide).
When do your hires hit full productivity?
10. Revenue Per Employee 📈
Formula: Total revenue ÷ FTE count
Example: A Bengaluru firm with ₹65 crore and 280 employees had ₹23.2 lakh/employee. Training raised it to ₹26 lakh.
What does this metric show about efficiency?
11. Training ROI 📚
Formula: (Benefits ÷ Costs) × 100
Example: A Pune pharma’s ₹6 lakh training boosted sales by ₹24 lakh (400% ROI).
How do you measure training impact?
12. Internal Promotion Rate 🔝
Formula: (Internal promotions ÷ Total promotions) × 100
Example: A Gurugram firm’s 13% rate hit 35% with career paths, saving ₹26 lakh.
Are your top performers staying?
13. Compensation Ratio ⚖️
Formula: (Salary ÷ Midpoint of range) × 100
Example: A Noida firm found 16% of women at 71% of midpoints. Adjustments to 93% cost ₹13 lakh, boosting retention by 12%. Use Payscale.
What pay gaps might you uncover?
14. Performance Rating Distribution 📊
Example: A Mumbai bank’s branch gave “exceeds” to 42% of staff, another 9%. Calibration fixed inconsistencies.
How fair are your ratings?
15. HR-to-Employee Ratio 🧑💼
Formula: HR FTEs ÷ Total FTEs
Example: A Chennai retailer’s 1:165 ratio caused errors. Outsourcing to 1:80 saved ₹6.5 lakh.
Is your HR team stretched?
AI-Powered Metrics for India 2025
How can AI boost people analytics in India 2025? PeopleStrong predicts attrition with 87% accuracy, saving ₹11 lakh yearly. Real-time pulses via ZingHR track eNPS instantly. A Bengaluru firm cut time-to-productivity by 16 days with AI, saving ₹5.5 lakh.
Which AI tool could transform your metrics?
Avoiding Metric Traps
Metrics can mislead. Here’s how to stay focused:
Vanity Metric | Actionable Alternative |
|---|---|
94% survey participation | Engagement score (3.7/5) |
55 hires | Cost per hire (₹21,000) |
Vanity Metrics: Participation rates mean little if engagement lags.
Silos: Share data via dashboards.
Overload: A client tracked 65 metrics! We cut to 8 key KPIs.
Which metrics might you be overvaluing?
Crafting Your Data Story
In 2023, I told a VP-HR turnover cost ₹1.4 crore—2.7% of profits. He listened. Make metrics resonate:
Compare to NASSCOM benchmarks.
Use heat maps for risks.
Frame 17% turnover as “28 lost mentors.”
Link faster hires to ₹8.5 lakh saved.
How will you present employee engagement metrics for Indian companies?
How will you present employee engagement metrics for Indian companies?
Your Metrics Action Plan
Audit three missing metrics.
Use tools like Keka.
Test two metrics quarterly.
Drop outdated metrics yearly.
Which metric will you track first?
Conclusion: Build Your 2025 HR Strategy
These 15 HR metrics for Indian startups—from turnover to eNPS—shape a thriving workplace culture. My favorite? A “trust index” predicting project success with 94% accuracy. Track one metric for 90 days and share results via our contact form. Which of these 15 metrics will you adopt first in your 2025 HR plan? Share your pick in the comments!
Stay ahead with monthly HR analytics tips: Follow us for more.
Trending Article
How to File a POSH Complaint in India: Step-by-Step Guide
Trending Article:
Standing Orders Act 2025: HR Guide to Compliance & Avoiding Fines


